Background
I’ve got a Java application running on Tomcat on Amazon EC2, which exposes RESTful web services delivering JSON to a variety of mobile apps and web sites.
I’m running a Squid server as a reverse proxy caching in front of the web services, to cache defined content at the HTTP layer.
(I’m also caching in the application layer using Ehcache and Spring – but adding the Squid cache in front of this lets me cache more content that just the JSON, and lets me take advantage of Squids proxy functions to manage back end services easily. It also takes more load off the Tomcat server – which is also running scheduled tasks to update the data in the system.)
This lets me run a pretty mixed environment, which suits my current purposes for delivering speedy content, removes load on my main app server and also doesn’t tie me to closely to any particular technical implementation in the back end. There is a complexity overhead, but part of the reason for doing this is to play with the technologies – so thats all part of the fun!
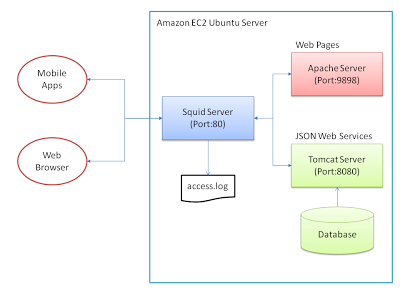
At the moment, all this is running on a single EC2 Ubuntu server instance.
All HTTP traffic comes into the Squid server, running on Port 80. This caches certain html, image, json, php, etc content (as defined in /etc/squid3/squid.conf) – and if it can’t find the request in the cache (or has been told not to cache it), will hand off to one of the upstream servers to service the request – Tomcat (on port 8080 – serving my Java web services, and admin App) or Apache (on port 9898 – serving my web sites, PHP/HTML).
So my basic setup is similar to this diagram:
The Problem – How to Analyse Web Service Traffic?
What I want to do is be able to track visitors across all web sites and mobile apps. I can track website visitors fine using Google Analytics. However, the mobile apps access the web services directly – so a client based tracker like Analytics cannot track these requests..
As all requests are routed through Squid – all access data sits in the squid ‘access.log’. This is the only place that knows about all the traffic (as this will log all access, whether delivered from the cache, or from the backend servers)
Although Squid provides the cachemgr tool – this is more geared to monitoring cache access, than actual detail of what is delivered, where and to who (which is the kind of info I’m more interested in)
My Solution
Looking at the various log analysis tools available – I decided to give AWStats a try – it’s free, seems well documented and commonly used
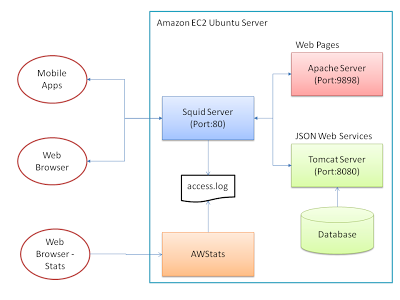
My goal was to get this AWStats set up on my Ubuntu box to read the Squid logs and provide some nice HTML output – updated on a regular basis so I could monitor usage through the day
So my plan was to end up with something like this:
Prerequisites
- Before I started – I already had these set up and running on my Ubuntu (version 12) box
- Squid Server (running on port 80)
- Apache (running on port 9898)
Step 1 : Install AWStats
sudo aptitude install awstats
sudo aptitude install libnet-ip-perl
sudo aptitude install libgeo-ipfree-perl
Step 2 : Configure Squid Logging
The next step is to change the format of the Squid logs. By default, Squids access.log is principally designed to only log the kind of info useful for logging caching activity (what was requested, when, was it served from the cache..)
An example of this is below
1369117923.612     26 209.20.75.224 TCP_MISS/200 4204 GET http://.../rest/feeds/v3/feeditem/9932/ - FIRST_UP_PARENT/tomcat application/json

1369117947.802      0 209.20.75.224 TCP_MEM_HIT/200 12130 GET http://.../rest/feeds/v3/latest/WH/2000-01-01-00-00? - NONE/- application/json

1369118022.040    139 209.20.75.224 TCP_MISS/200 12929 GET http://.../rest/feeds/v3/search/JAVA/JSF - FIRST_UP_PARENT/tomcat application/json

1369118027.240      0 209.20.75.224 TCP_MEM_HIT/200 12130 GET http://.../rest/feeds/v3/latest/WH/2000-01-01-00-00? - NONE/- application/json

1369118041.264      0 209.20.75.224 TCP_MEM_HIT/200 12130 GET http:/.../rest/feeds/v3/latest/WH/2000-01-01-00-00? - NONE/- application/json

1369118062.362      0 209.20.75.224 TCP_MEM_HIT/200 12130 GET http://.../rest/feeds/v3/latest/WH/2000-01-01-00-00? - NONE/- application/json

1369118062.811      0 96.28.139.57 TCP_MEM_HIT/200 9397 GET http://.../rest/image/38 - NONE/- image/png

1369118062.830      0 96.28.139.57 TCP_MEM_HIT/200 6936 GET http://.../rest/image/44 - NONE/- image/png
For AWStats to analyse it, and provide more information – we need to change the logging format to a more Apache style log. Something like this:
92.40.254.172 - - [23/May/2013:14:52:25 +0000] "GET http://.../rest/image/34 HTTP/1.1" 200 5043 "-" "Mozilla/5.0 (Linux; U; Android 2.3.6; en-gb; U8815 Build/HuaweiU8815C02B895) AppleWebKit/533.1 (KHTML, like Gecko) Version/4.0 Mobile Safari/533.1" TCP_MEM_HIT:NONE

86.150.72.140 - - [23/May/2013:14:53:26 +0000] "GET http://.../rest/feeds/v3/jsonp/feeditem/20112? HTTP/1.1" 200 5277 "-" "Mozilla/5.0 (Linux; U; Android 2.2; en-gb; HTC Desire Build/FRF91) AppleWebKit/533.1 (KHTML, like Gecko) Version/4.0 Mobile Safari/533.1" TCP_MISS:FIRST_UP_PARENT

86.150.72.140 - - [23/May/2013:14:53:39 +0000] "GET http://.../rest/feeds/v3/jsonp/feeditem/20109? HTTP/1.1" 200 7114 "-" "Mozilla/5.0 (Linux; U; Android 2.2; en-gb; HTC Desire Build/FRF91) AppleWebKit/533.1 (KHTML, like Gecko) Version/4.0 Mobile Safari/533.1" TCP_MISS:FIRST_UP_PARENT
To change the /var/log/squid3/acccess.log logging format – add the following lines to /etc/squid3/squid.conf
logformat combined %>a %ui %un [%{%d/%b/%Y:%H:%M:%S +0000}tl] "%rm %ru HTTP/%rv" %Hs %<st "%{Referer}>h" "%{User-Agent}>h" %Ss:%Sh

access_log /var/log/squid3/access.log combined
Stop Squid, backup up and remove the old /var/log/squid3/access.log and restart squid – now all logging from this point on will use this new file format – which AWStats will process
sudo stop squid3
sudo mv /var/log/squid3/access.log /var/log/squid3/access.log.backup
sudo start squid3
Step 3 : Configure AWStats
We need to tell AWStats which log file we want to use, and what the format is.
There are various ways you can configure your domain in AWStats. For simplicity here – I’m just assuming we have one domain and just use the ‘out-the-box’ awstats.conf configuration (I believe it is common practice to have different conf files for each domain – but we’ll just use the default for now).
Find the following lines in ‘/etc/awstats/awstats.conf’ – and change them to these settings (see more details of setting the LogFormat here):
LogFile="/var/log/squid3/access.log
LogFormat=1
SiteDomain=yourdomainname
Step 4 : Generating A Report
Now we have AWStats installed and configured, and Squid logging the correct format, we can generate an analysis report. Use the following command to do this:
sudo /usr/lib/cgi-bin/awstats.pl -config=awstats.conf –update
This should give you aome output similar to:
sudo /usr/lib/cgi-bin/awstats.pl -config=awstats.conf -update
Create/Update database for config "/etc/awstats/awstats.conf" by AWStats version 7.0 (build 1.971)
From data in log file "/var/log/squid3/access.log"...
Phase 1 : First bypass old records, searching new record...
Direct access after last parsed record (after line 412)
Jumped lines in file: 412
 Found 412 already parsed records.
Parsed lines in file: 53
 Found 25 dropped records,
 Found 0 comments,
 Found 0 blank records,
 Found 0 corrupted records,
 Found 0 old records,
 Found 28 new qualified records.
Step 5 : Configuring Apache/Squid To View Reports
Now we have AWStats installed, and Squid logging the correct format, the next step is to setup Apache and Squid to view the reports.
We want to view the reports on the URL:
http://yourdomainname/statistics/awstats.pl
Because all our traffic goes through Squid – we just need to add some directives to ‘/etc/squid3/squid.conf’ to redirect any urls going via ‘/statistics’ directly to the Apache server. We also map ‘/awstats’ urls to the apache server too – to catch the css and js files AWStats references.
# allow access to the awstats.pl - redirect to Apache
acl statisticsAcl url_regex -i (/statistics)
cache deny statisticsAcl
http_access allow statisticsAcl
cache_peer 127.0.0.1 parent 9898 0 no-query originserver name=statisticsPeer
cache_peer_access statisticsPeer allow statisticsAcl

# allow access to the awstats css, js, etc - redirect to Apache
acl awstatsAcl url_regex -i (/awstats)
cache deny awstatsAcl
http_access allow awstatsAcl
cache_peer 127.0.0.1 parent 9898 0 no-query originserver name=awstatsPeer
cache_peer_access awstatsPeer allow awstatsAcl
We then need to configure Apache to work with AWStats. We can easily do this by creating a new file ‘/etc/apache2/conf.d/statistics’ (with the following content):
Alias /awstatsclasses "/usr/share/awstats/lib/"
Alias /awstats-icon/ "/usr/share/awstats/icon/"
Alias /awstatscss "/usr/share/doc/awstats/examples/css"
ScriptAlias /cgi-bin/ /usr/lib/cgi-bin/
ScriptAlias /statistics/ /usr/lib/cgi-bin/
Options ExecCGI -MultiViews +SymLinksIfOwnerMatch
Last step is just to restart Apache and Squid
sudo /etc/init.d/apache2 restart
sudo stop squid3
sudo start squid3
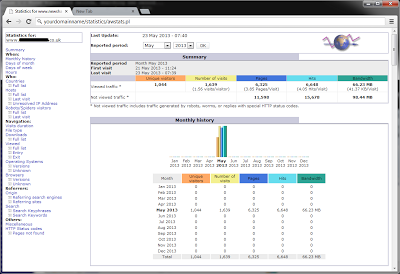
You should then be able to access your stats on ‘http://yourdomainname/statistics/awstats.pl‘:
Step 6 : Scheduling as a Cron Job
If you want to schedule the stats to be updated (say, every 30 minutes) – just add this to ‘/etc/crontab’
*/30 * * * * root /usr/lib/cgi-bin/awstats.pl -config=awstats.config -update > /dev/null
Step 7 : Option – Generate Static Web Pages
So far – everything we do calls the awstats.pl perl script which re-generates the same web pages dynamically with the latest info.
If you want to – you can also generate static web pages. For example – I want to generate static pages – a different set each day (with the year, day and month in the HTML page title).
You can do this with the following command:
sudo /usr/share/awstats/tools/awstats_buildstaticpages.pl -awstatsprog=/usr/lib/cgi-bin/awstatsl.pl -config=awstats.conf -dir=/var/www/awstats-report -builddate=%YYYY-%MM-%DD
This will create a set of pages in ‘/var/www/awstats-report/’ with the format ‘awstats.awstats.conf.130524.html‘ (note: you will have to create the /var/www/awstats-report/ directory with the correct permissions.
You will have to add a new set of rules to ‘/etc/squid3/squid.conf’ to:
# allow access to the awstats static reports folder - redirect to Apache
acl awstatsReportAcl url_regex -i (/awstats-report)
cache deny awstatsReportAcl
http_access allow awstatsReportAcl
cache_peer 127.0.0.1 parent 9898 0 no-query originserver name=awstatsReportPeer
cache_peer_access awstatsReportPeer allow awstatsReportAcl
Similarly – you can schedule this to run on a regular basis. For example, to run at 55 minutes past the hour, every hour – add this line to ‘/etc/crontab’
55 * * * * root /usr/share/awstats/tools/awstats_buildstaticpages.pl -awstatsprog=/usr/lib/cgi-bin/awstatsl.pl -config=awstats.conf -dir=/var/www/awstats-report -builddate=%YYYY-%MM-%DD
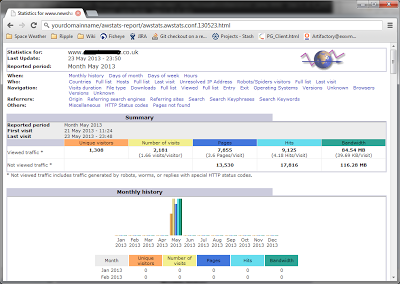
You can then access the static pages on the url: ‘yourdomainname/awstats-report/awstats.awstats.conf.130523.html’
Conclusion
Take all the above with a pinch of salt – I’m sure there are better ways to do some of it, it was learning experience for me – and at the end, delivered what I was after.
I think Squid is a great product, especially for a developer like myself who wants to play with different tech and swap it in/and out of my environment. It’s proxying abilities allow you to swap implementatations and server locations with relative ease.
And in it’s main role – as a reverse proxy web acceleration server – it’s been performing excellently, speeding up web service and image serving with never a grumble. Now I have AWStats up and running – I can drill down and get a lot more information about what’s going on under the covers!


